Truncated normal is not normal
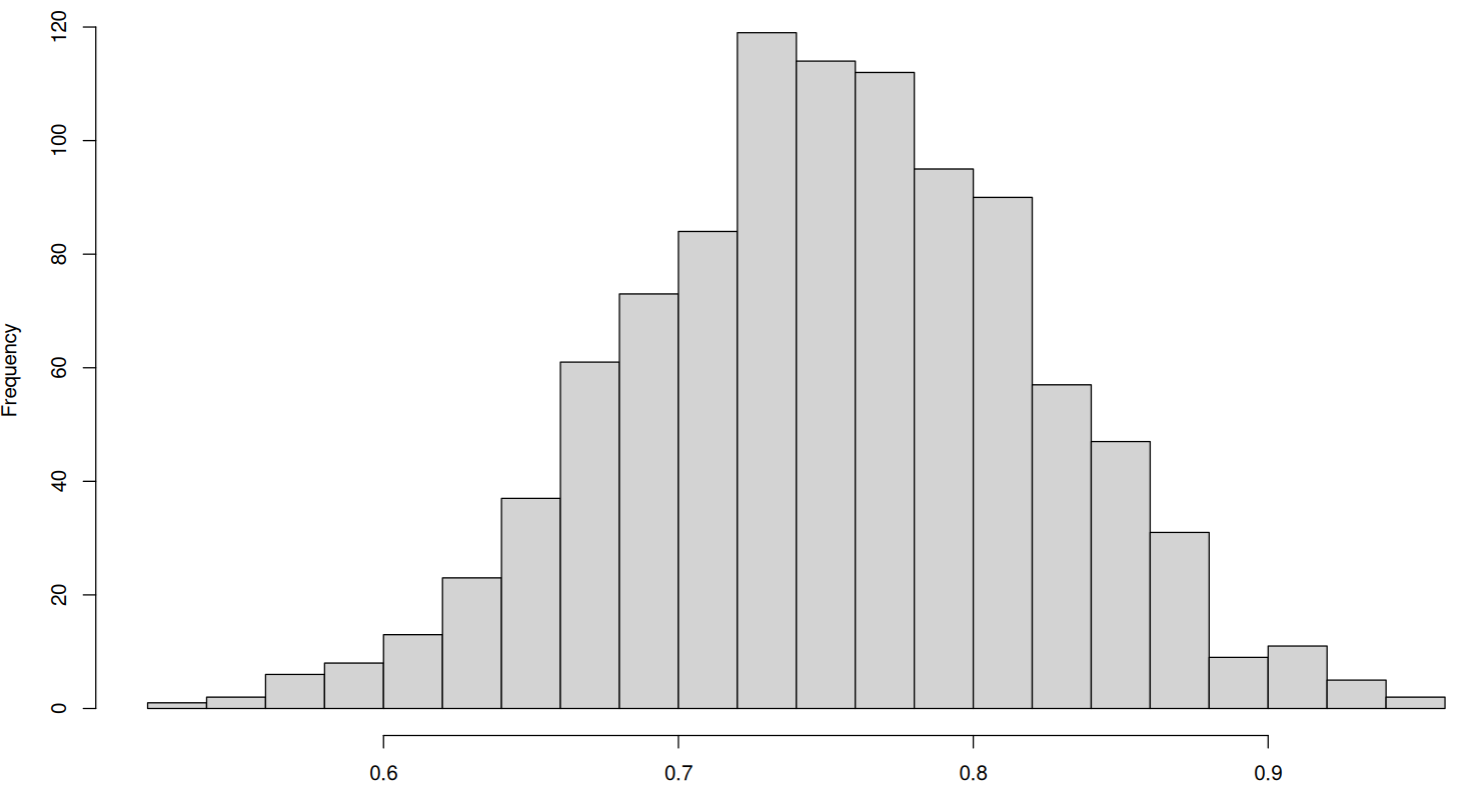
In my research I have to deal with many Monte-Carlo simulations of normalized variables that fall in the interval $\left[ 0, 1 \right]$. By the Central Limit Theorem I can usually safely assume that the values are normal. And, indeed, upon some checking I get nice bell curves like this:
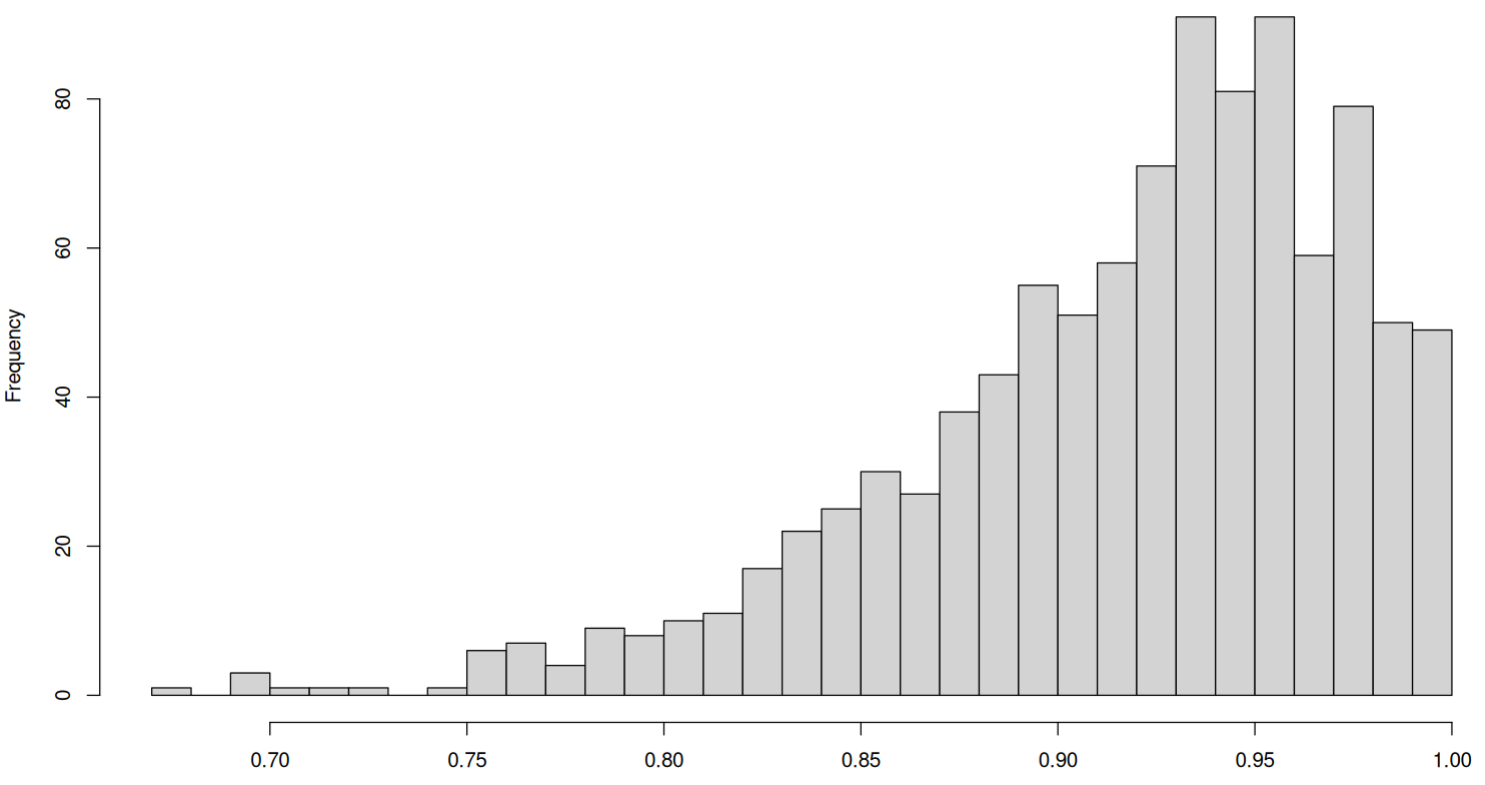
However, the variable of interest is bounded by $0$ and $1$, we can sometimes have a truncated histogram like this:

But we still trust in Central Limit Theorem, right? So, we can test our hypotheses with $t$ test as is, right? ….right?
I am afraid not… No matter how “bell” it looks, it is not normal. Let’s use very standard normality checks to convince ourselves.
Let’s start with Q-Q plot, which simply plots the quantiles of a normal distribution against the quantiles of the distribution of interest. If the two distributions are equal we expect a somewhat straight upward sloping line:
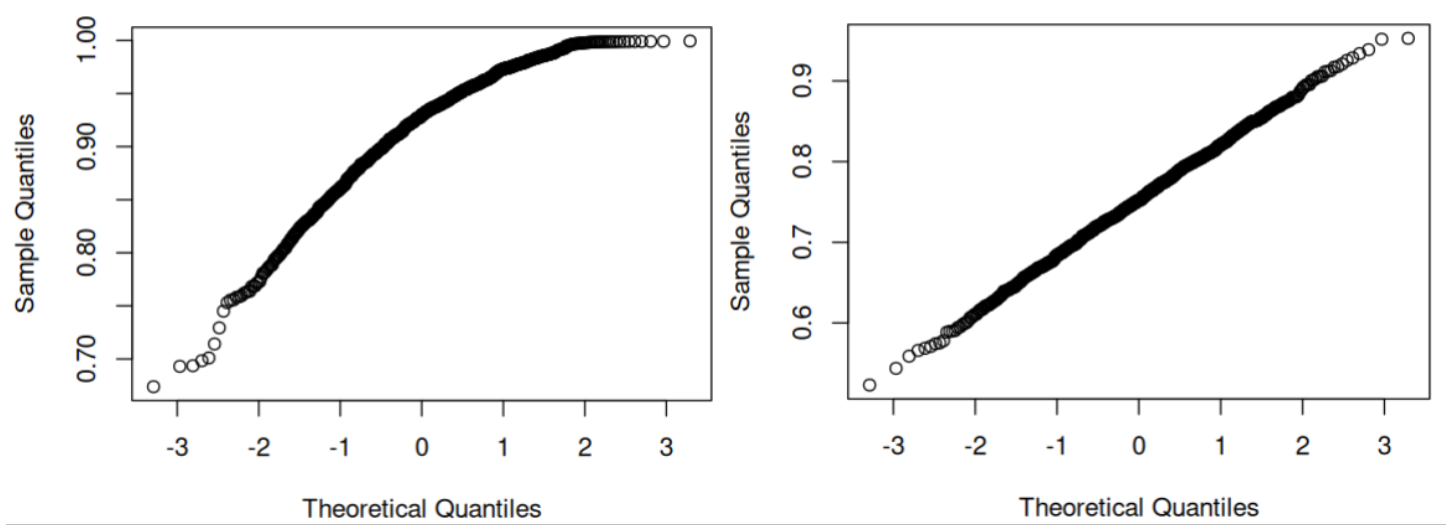
As you can see, the bell curve returns a straight line while the truncated bell curve does not.
Next, let’s try a more rigorous approach – the Shapiro-Wilk test:
> shapiro.test(bellCurveObs)
	Shapiro-Wilk normality test

data:  bellCurveObs
W = 0.99913, p-value = 0.9305

> shapiro.test(truncatedBellCurveObs)
	Shapiro-Wilk normality test

data:  truncatedBellCurvObs
W = 0.93384, p-value < 2.2e-16
We see that it pretty significantly rejects the null hypothesis that the truncated normal distribution can be treated as normal.
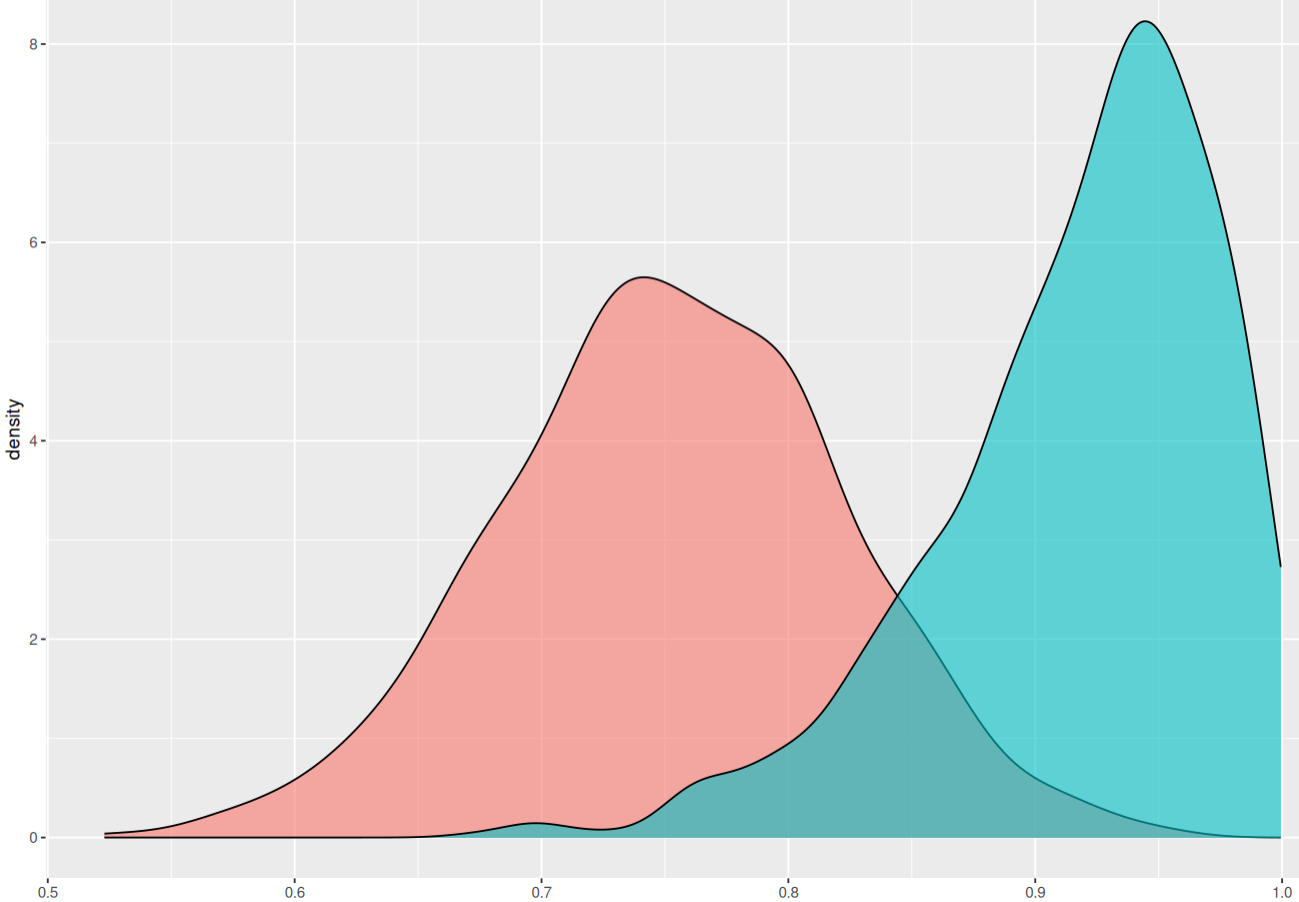
Finally, let’s try out the most likely distribution of our data between 0 and 1 — the $Beta$ distribution. After playing around with parameters for two minutes I found a candidate: $Beta(10, 1.8)$ that might be confused for a truncated normal distribution:
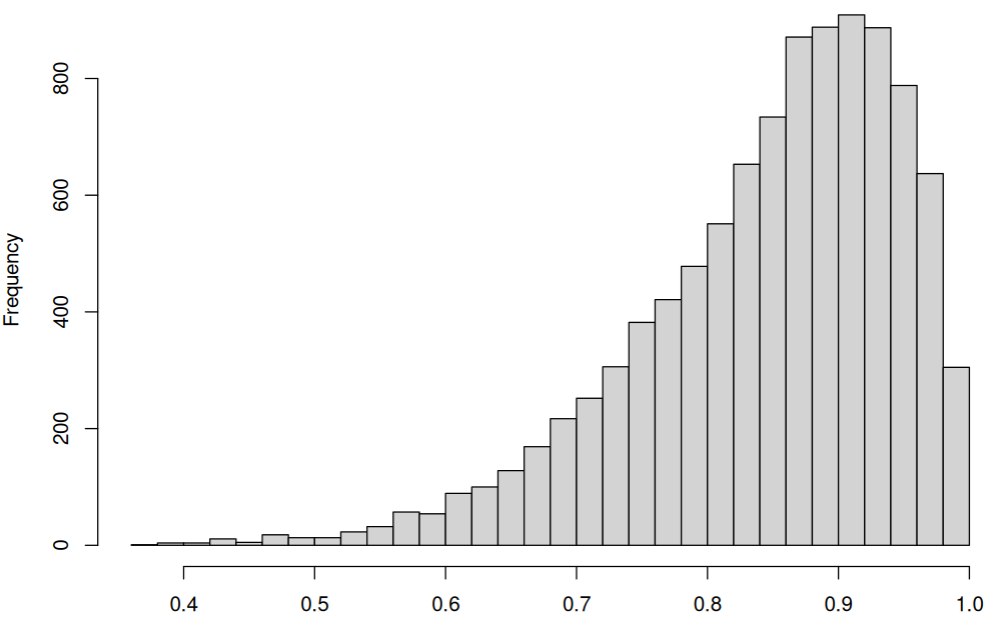
So, yeah… sorry, but no $t$-tests in this case. Luckily, there are many cool non-parametric tests for you out there. You can start with Mann-Whitney test.


